OPEN TO NEW OPPORTUNITIES ↗

DATA MANAGEMENT / ANALYTICS / BUSINESS INTELLIGENCE

Making data
make sense.

I'm Aditya Prakash, a Data Management Executive turning complex information into reliable reporting, meaningful dashboards, and clearer business decisions.

CURRENTLY ATJRS Dynamics Info Solutions
FOCUS AREASPower BI · Excel · SQL
DATA / INSIGHTSLIVE VIEW · CONCEPT
ANALYTICS WORKSPACE

From data to direction.

↗
01 / CLEANPrepareTrustworthy data
02 / ANALYZEExploreMeaningful patterns
03 / REPORTDecideActionable insights
INSIGHT DEVELOPMENT ↗
STRUCTURECLARITYIMPACT
✦ INSIGHTS OVER INFORMATION
01 / ABOUT ME

More than numbers.
It's about what they mean.

Good decisions start with good data.

I'm a Data Management Executive at JRS Dynamics Info Solutions, with hands-on experience in collecting, cleaning, validating, and transforming data for business use.

My interest lies at the intersection of data accuracy and business understanding. I enjoy building Power BI dashboards, working with Excel and SQL, and turning complex datasets into reporting that people can actually use.

I'm exploring new opportunities in Data Analytics, Business Intelligence, MIS Reporting, Research Analysis, and Power BI development.

Let's work together ↗
02 / EXPERIENCE

Built on practical
data experience.

CURRENT ROLE

Data Management
Executive

JRS Dynamics Info Solutions

  • Managed data collection, validation, and reporting for sales teams across six countries: India, Philippines, Saudi Arabia, UAE, Qatar, and Oman.
  • Designed seven interactive Power BI dashboards using DAX and Power Query to monitor sales KPIs and target achievement.
  • Generated 9,000+ leads monthly using ZoomInfo and Apollo to support sales prospecting and pipeline development.
  • Automated data workflows using advanced Excel formulas and Microsoft Dynamics 365 Business Central, improving reporting efficiency and maintaining data reliability.
03 / SELECTED WORK

Projects that turn
data into answers.

Selected Power BI dashboard projects demonstrating data modeling, visualization, KPI tracking, and business-focused reporting.

PROJECT 01 / RETAIL SALES ANALYTICS

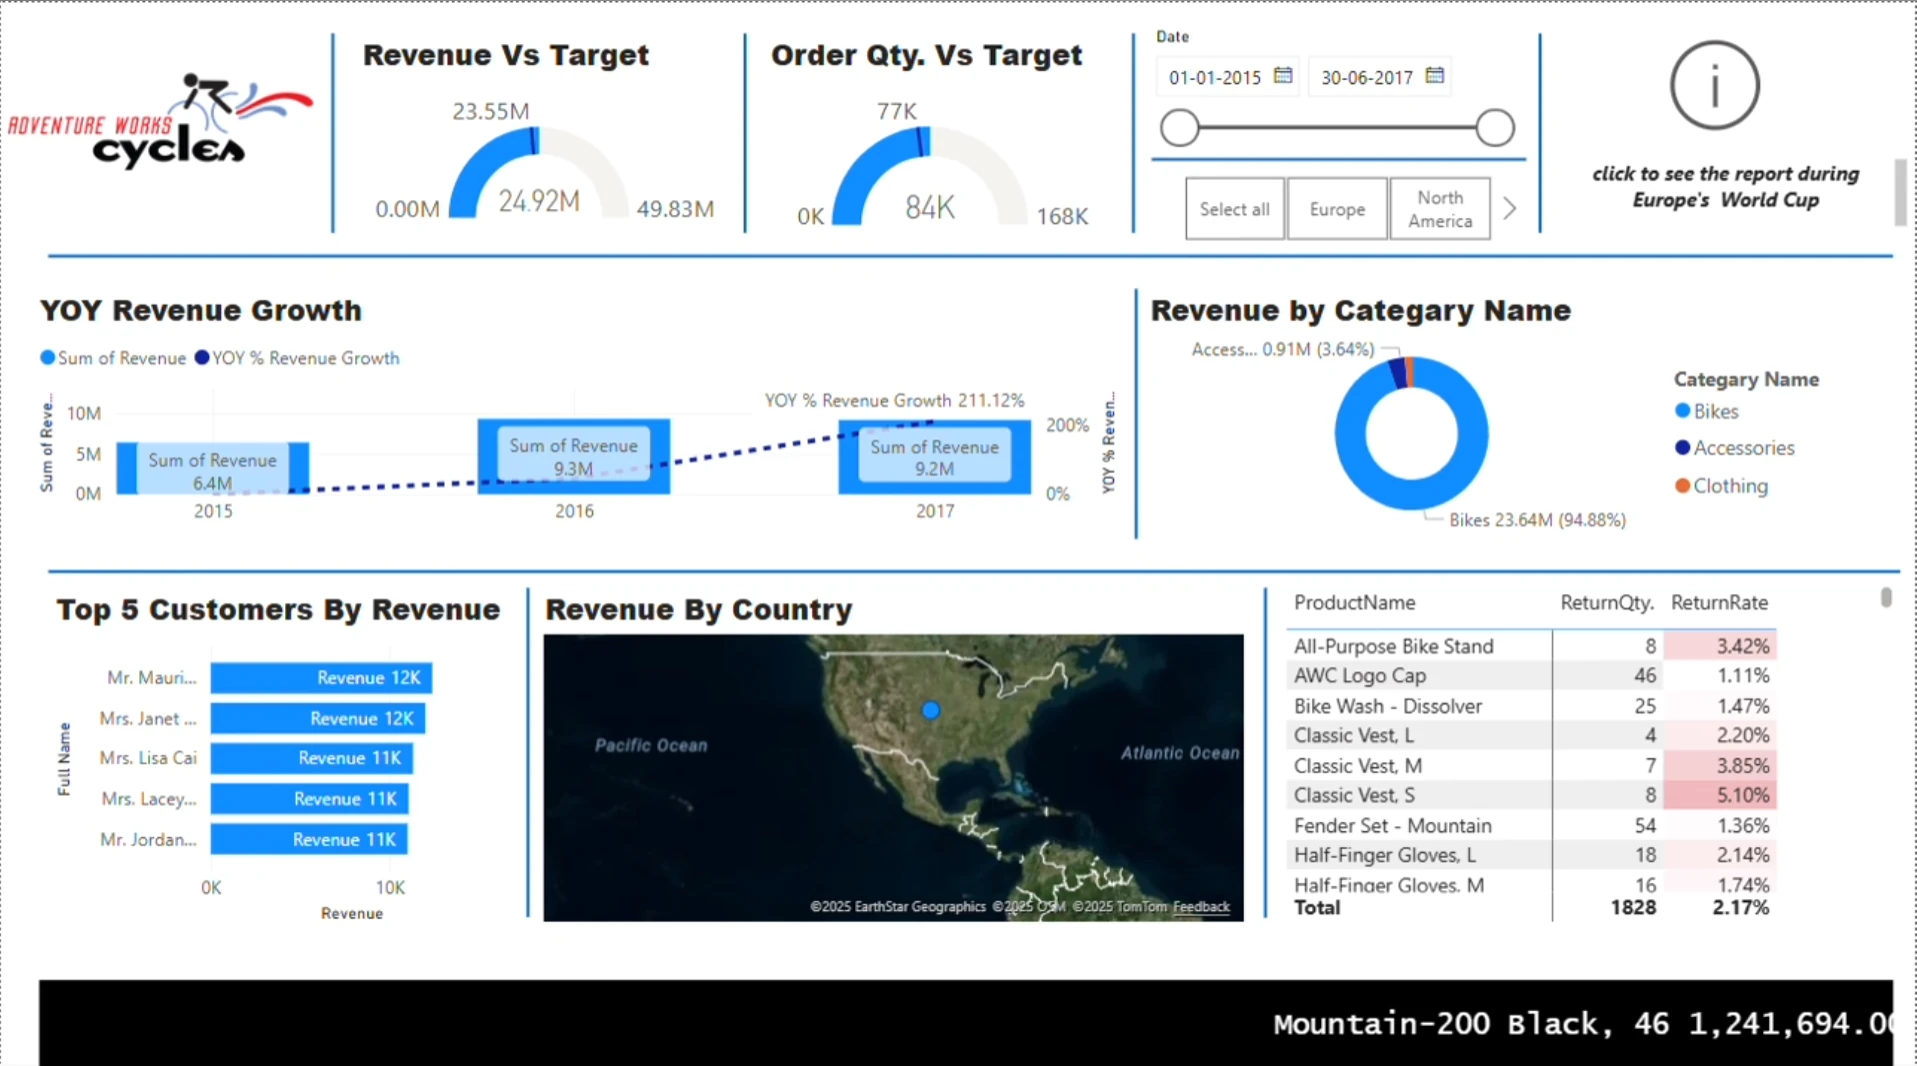
Adventure Works Sales Dashboard

Built an end-to-end Power BI reporting solution using the Adventure Works retail dataset. Cleaned and transformed raw files into a structured data model, then developed interactive visualizations to evaluate revenue performance, product categories, customer behavior, geographic trends, and product returns.

Dashboard highlights: Revenue versus target, year-over-year growth, regional sales, category contribution, and product return rates.

Power BIPower QueryDAXData Transformation
Watch project walkthrough ↗
PROJECT 02 / HR ANALYTICS

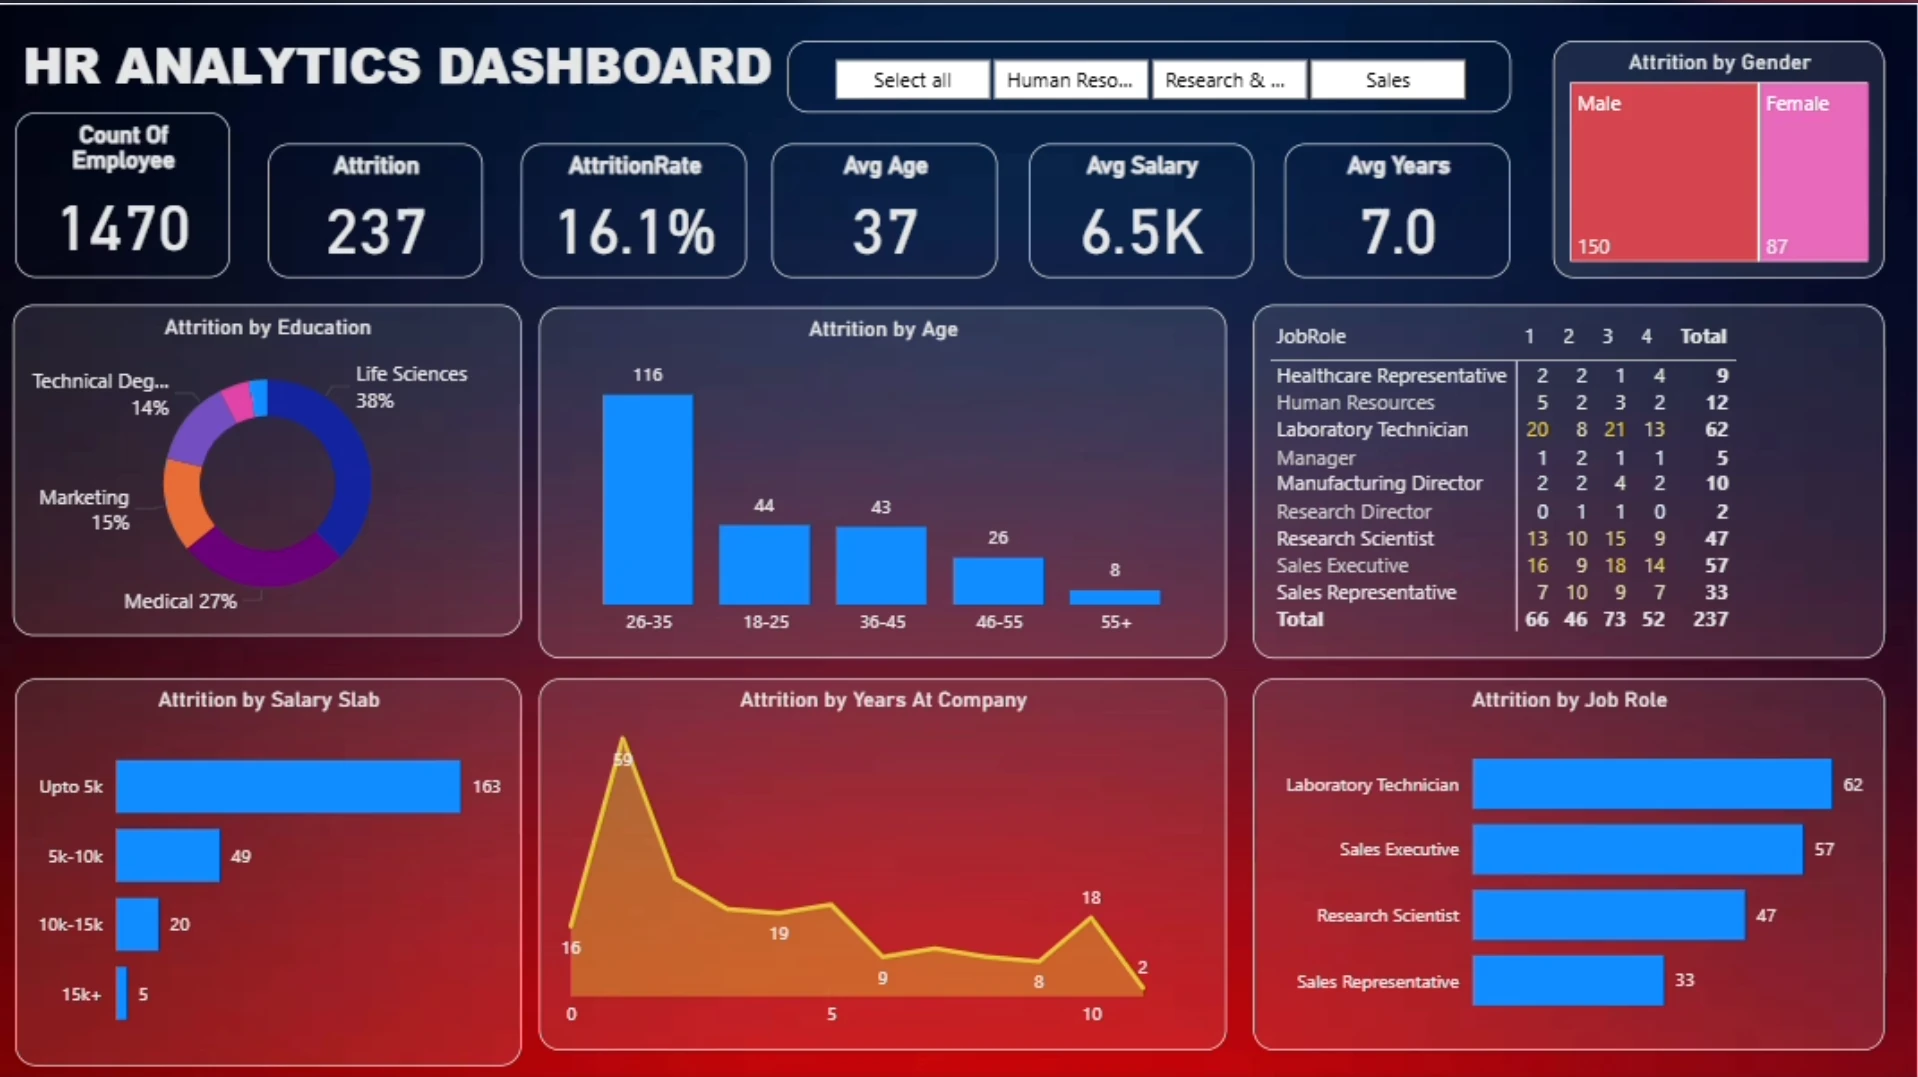
HR Attrition Analysis Dashboard

Transformed raw HR data into an interactive Power BI dashboard to examine employee turnover across departments, job roles, age groups, income levels, and tenure. Used DAX measures, calculated columns, and dynamic filters to help identify workforce patterns relevant to employee retention.

Dashboard highlights: 1,470 employees, 237 attrition cases, a 16.1% attrition rate, and comparisons across employee demographics and job roles.

Power BIDAXHR AnalyticsData Cleaning
Watch project walkthrough ↗
PROJECT 03 / E-COMMERCE ANALYTICS

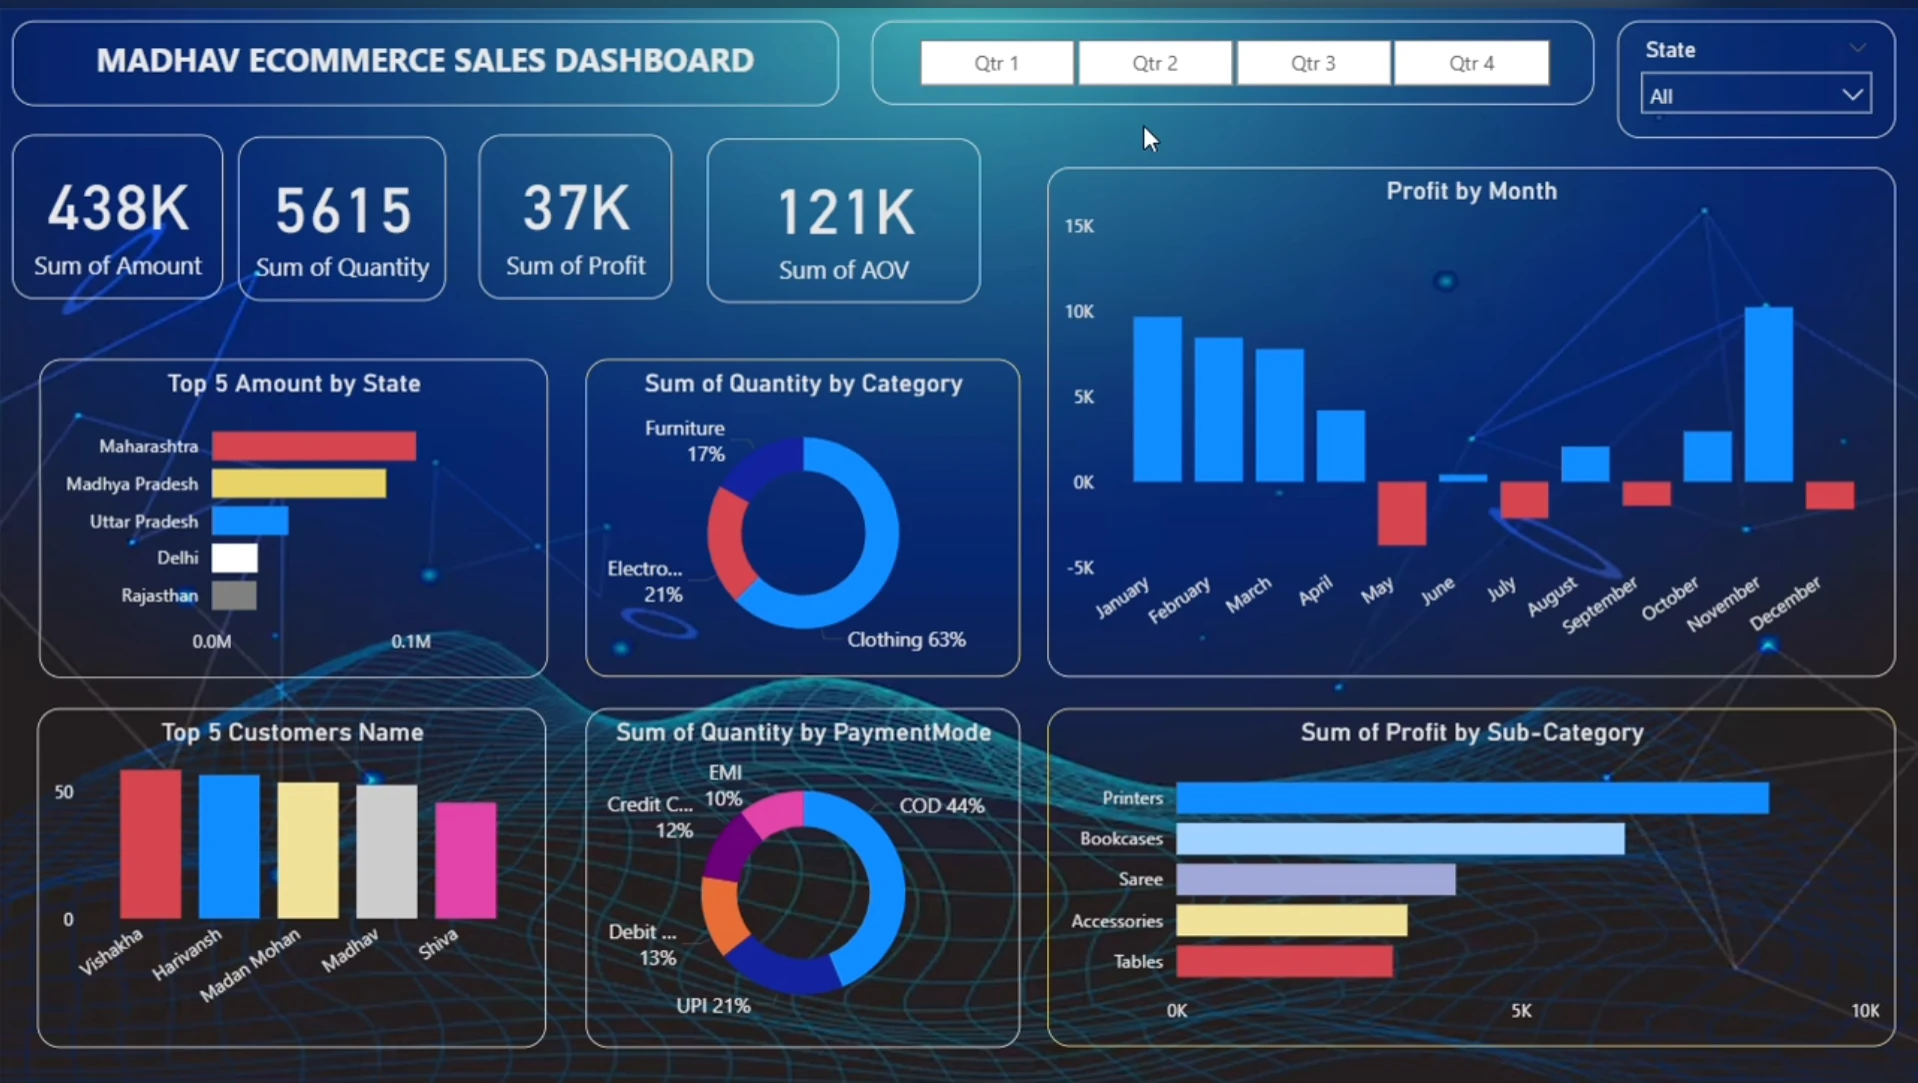
Madhav E-Commerce Sales Dashboard

Developed an interactive Power BI dashboard to analyze sales, profitability, order quantities, and customer purchasing behavior. Built a structured data model with DAX measures, drill-down capabilities, and dynamic slicers to explore performance across states, product categories, payment methods, and customers.

Dashboard highlights: 438K sales amount, 37K profit, monthly profitability trends, and state-wise sales comparisons.

Power BIDAXData ModelingInteractive Slicers
Watch project walkthrough ↗
04 / TOOLKIT

The right tools.
The right questions.

◫
01 / VISUALIZE

Business Intelligence

Building reports that make performance understandable.

Power BIDAXPower QueryData ModelingKPI Dashboards
⌗
02 / ANALYZE

Data & Reporting

Preparing dependable datasets and clear reporting workflows.

Advanced ExcelPostgreSQLData CleaningValidationMIS Reporting
◎
03 / RESEARCH

Business Research

Gathering and structuring information for business intelligence.

ZoomInfoApolloLushaLinkedInLead Research
05 / CONTINUOUS LEARNING

Always building.
Always learning.

✳
CERTIFICATION

Excel Masterclass — Beginner to Advanced

Instructor: Lokesh Lalwani

Credential ID: 6oqy3wmoh0
✓ COMPLETED
✳
CERTIFICATION

Power BI Masterclass — Basic to Advanced

Instructor: Lokesh Lalwani · Issued June 17, 2025

Credential ID: tfnfodzg7x
✓ COMPLETED
06 / LET'S CONNECT

Let's make
something count.

Looking for someone who values accurate data, thoughtful analysis, and reporting that drives decisions? I'd love to hear about your opportunity.

adityaprakash9318@gmail.com ↗